Glycan Shield
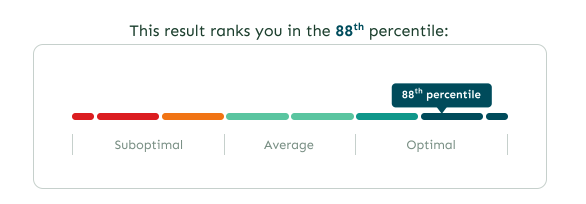
The Glycan Shield index uses the "Spercentile" metric from raw data. A higher result is better for the patient and the graph is colored from red to blue.
- Spercentile - The percentile of the patient
The Glycan Shield index uses the "Spercentile" metric from raw data. A higher result is better for the patient and the graph is colored from red to blue.