Introduction
This documentation contains instructions for GlycanAge partners on how to render different modules of the GlycanAge report as well as how to use the Partner REST API.
This document does not delve in to the science behind GlycanAge or does it attempt to explain any relatinoships between glyo peaks and rendered indexes and diseases. For this please refer to our guidebook or contact us directly at partners@glycanage.com.
Rendering Modules
GlycanAge uses the "raw" data generated by our laboratory analysis to render a GlycanAge report. Raw data is downloadable through the partner dashboard as well as the API for a patients report.
You can find a sample of what this data looks like here.
Instructions for rendering these modules outside of GlycanAge can be found in this documentation.
Rendering Indexes
We display 5 different indexes in our reports which we seperate in to primary and supportive indexes.
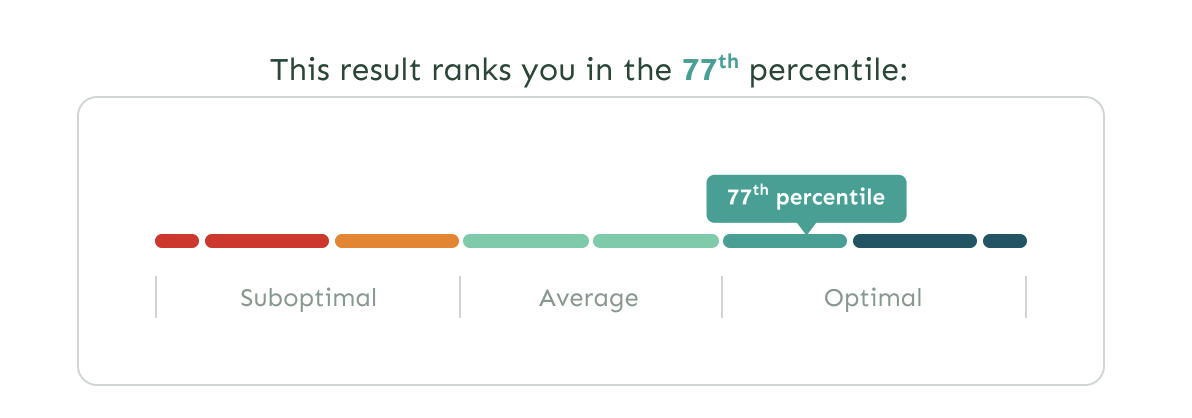
Looking at the raw data we use the following metrics to render each of the graphs:
- Spercentile - Glycan Shield percentile of the patient
- G2percentile - Glycan Youth percentile of the patient
- G0percentile - Glycan Mature percentile of the patient
- G1percentile - Glycan Median percentile of the patient
- Bpercentile - Glycan Bisection percentile of the patient
With some indexes (Glycan Mature and Glycan Bisection) a lower result is better. In these cases instead of going from read to blue the graph is switched and it goes from blue to red.
| Index | Type | Direction |
|---|---|---|
| Glycan Shield | Primary | Min 🔴 -> Max 🔵 |
| Glycan Youth | Primary | Min 🔴 -> Max 🔵 |
| Glycan Mature | Primary | Max 🔵 -> Min 🔴 |
| Glycan Median | Supportive | Min 🔴 -> Max 🔵 |
| Glycan Bisection | Supportive | Max 🔵 -> Min 🔴 |
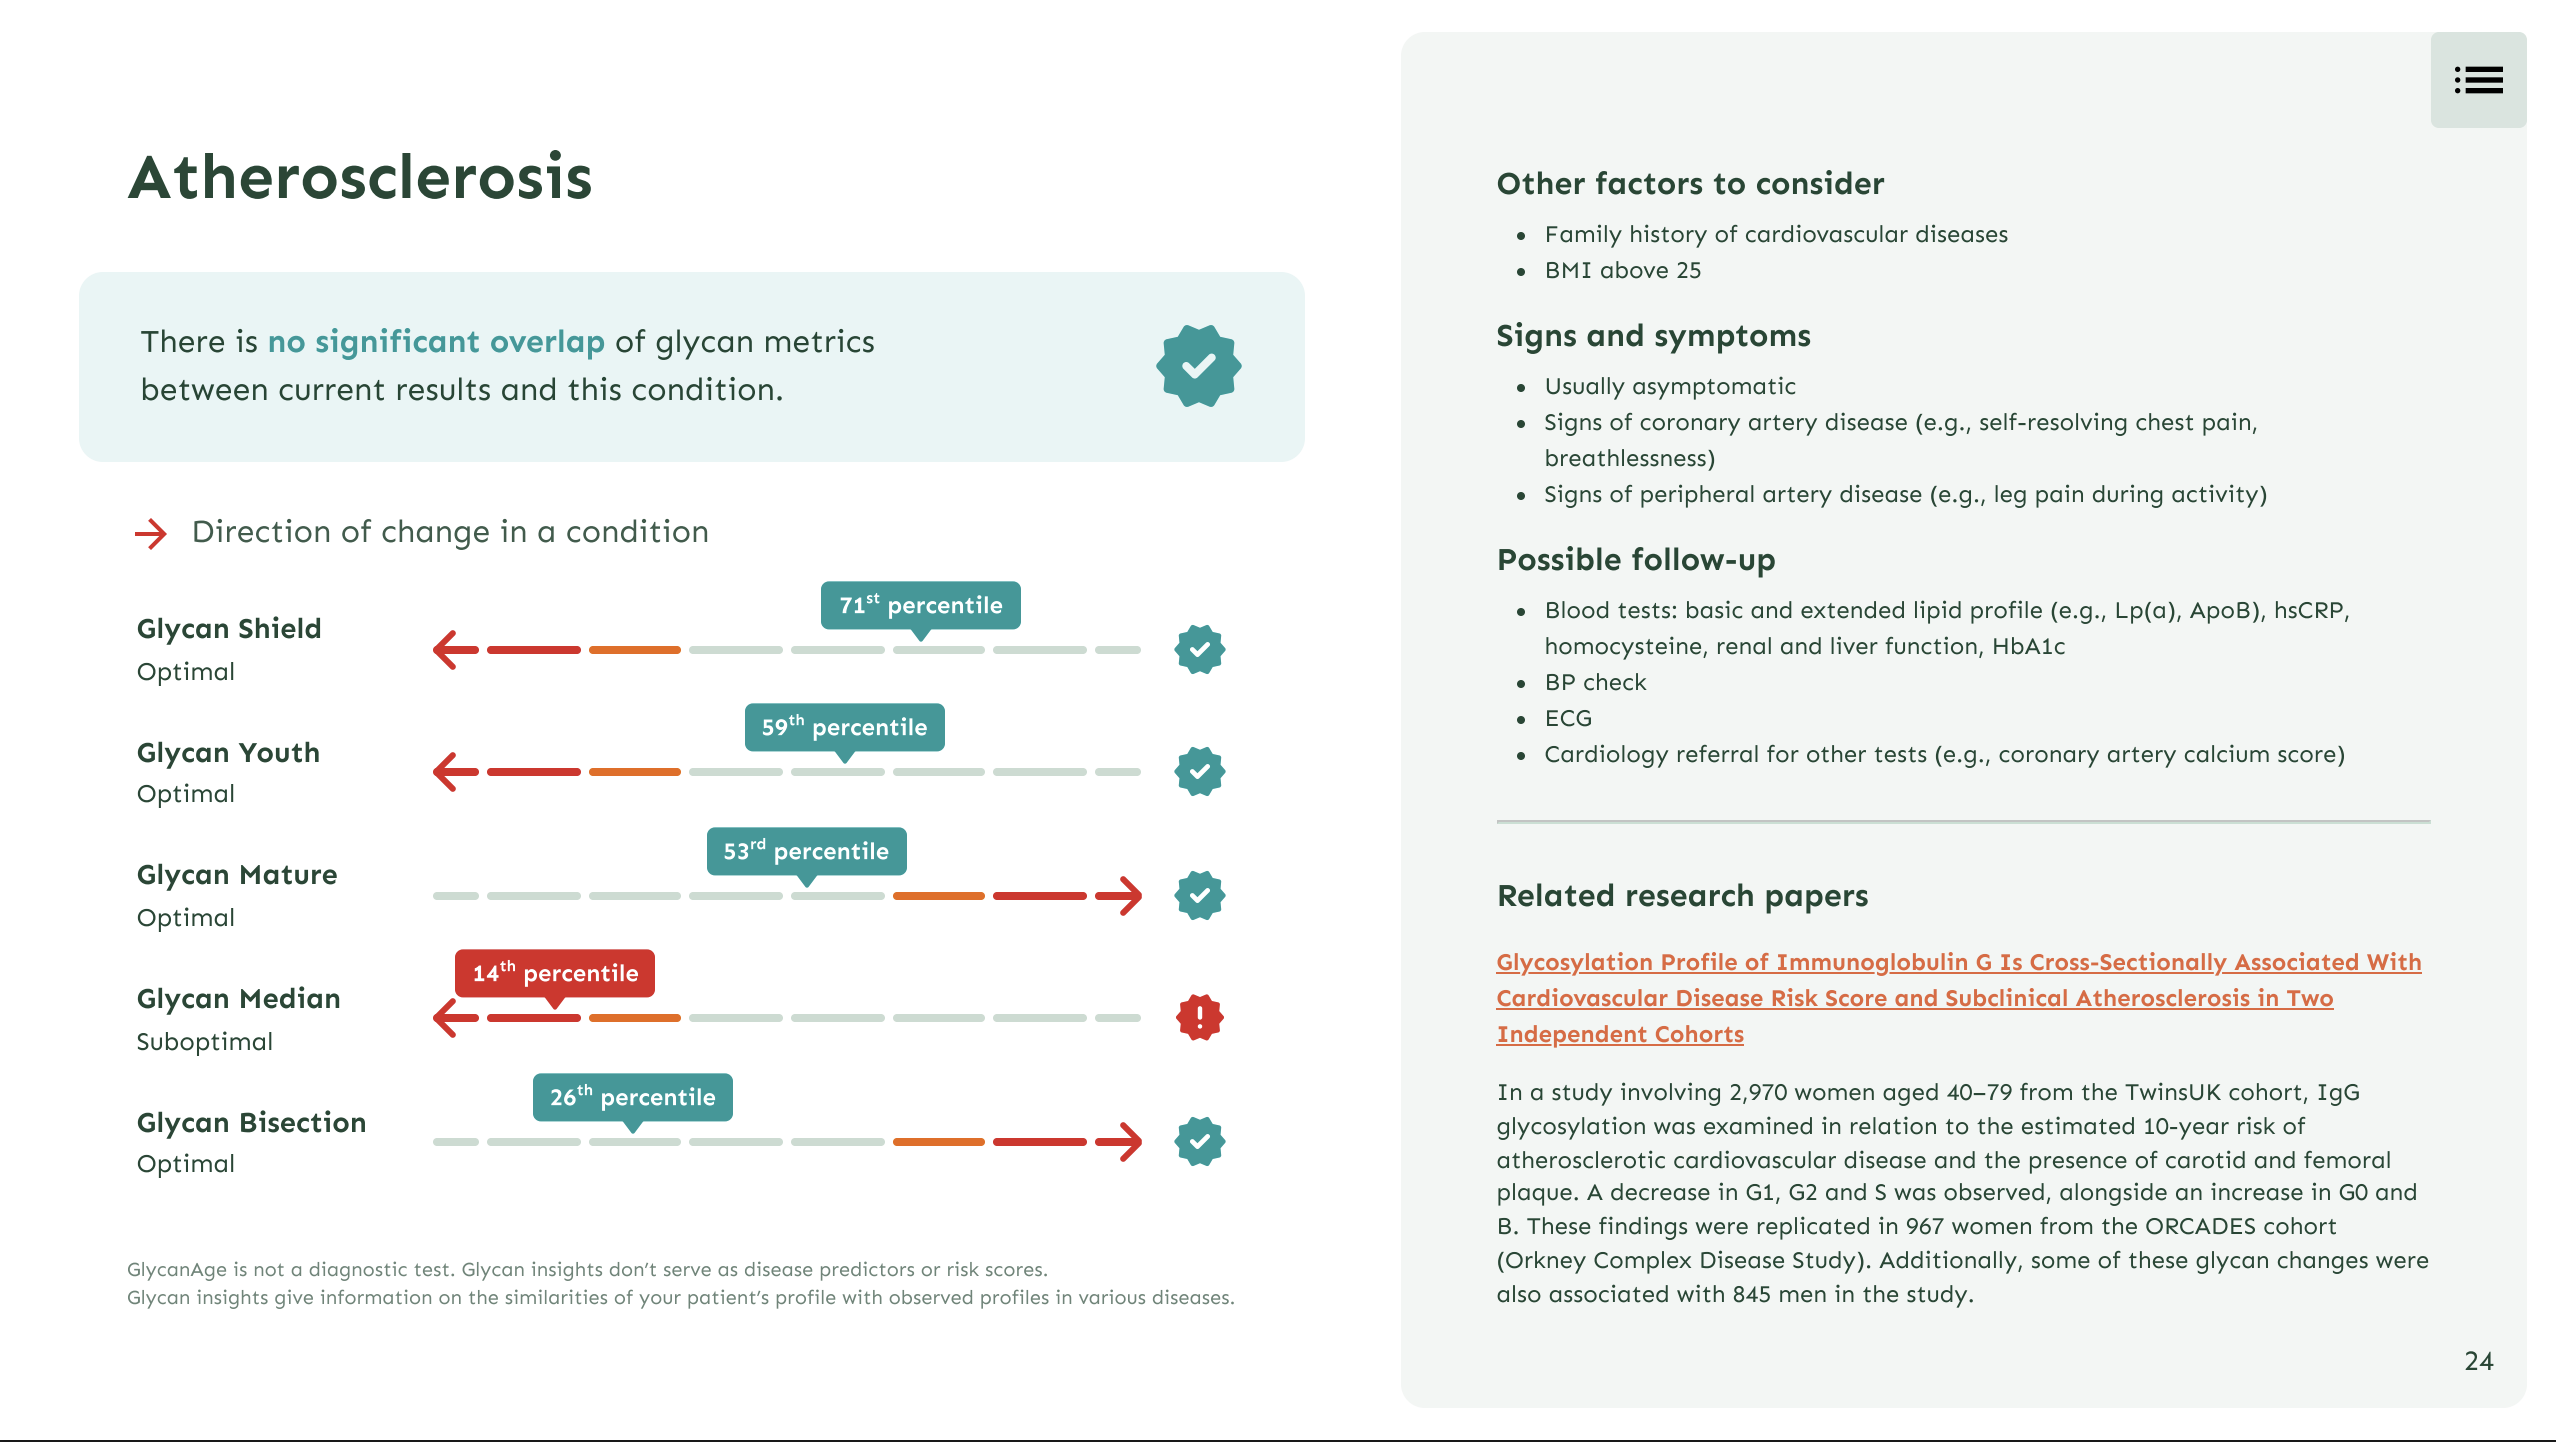
Rendering Diseases
When rendering diseases we us our web component library ga-components. It's published under the MIT license and available via npm.
Using our component library is what we recommend for rendering diseases. However, these are very opinionated and ridgid components available as seen on the GlycanAge report and we understand they might not be suited for all use cases.
Depending on the disease there can be anywhere between one and five associated metrics.
There are 13 different diseases displayed in our report. In order of appearance they are: