Introduction
These docs are for GlycanAge partners. They cover how to render the different modules of the GlycanAge report yourself, and how to use the Partner REST API.
Reselling GlycanAge kits from your own webshop instead? Have a look at the Reseller REST API. You place orders programmatically, we drop-ship each kit to your customer, and you pull their results back.
These docs don't cover the science behind GlycanAge, and they don't try to explain how glycan peaks relate to the indexes and diseases we render. For that, have a look at our guidebook or just email us at partners@glycanage.com.
Rendering Modules
We build the GlycanAge report from the "raw" data our laboratory analysis produces. You can download that raw data for a patient's report from the partner dashboard or from the API.
You can find a sample of what this data looks like here.
If you want to render these modules outside of GlycanAge, the rest of these docs explain how.
Rendering Indexes
Our reports show 5 indexes, split into primary and supportive ones.
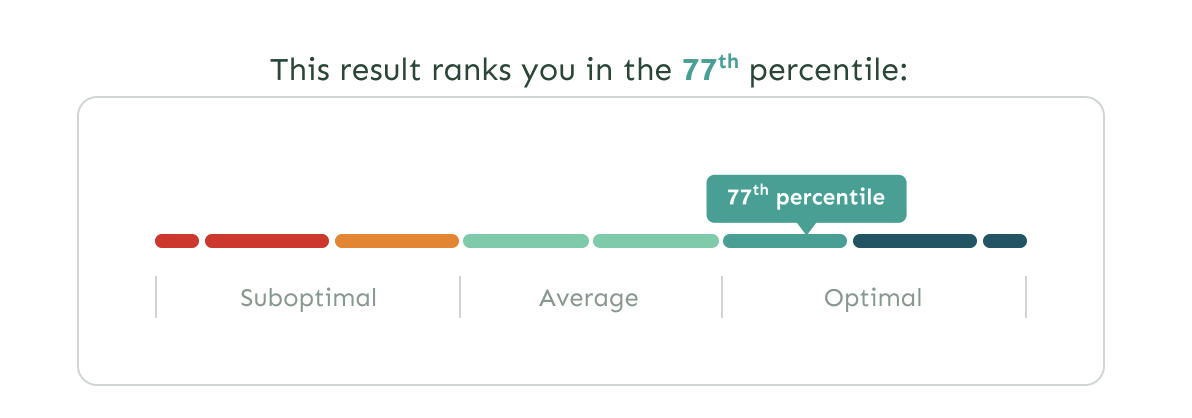
Looking at the raw data we use the following metrics to render each of the graphs:
- Spercentile - Glycan Shield percentile of the patient
- G2percentile - Glycan Youth percentile of the patient
- G0percentile - Glycan Mature percentile of the patient
- G1percentile - Glycan Median percentile of the patient
- Bpercentile - Glycan Bisection percentile of the patient
For some indexes (Glycan Mature and Glycan Bisection) a lower result is the better one. There the graph is flipped, so it runs from blue to red rather than from red to blue.
| Index | Type | Direction |
|---|---|---|
| Glycan Shield | Primary | Min 🔴 -> Max 🔵 |
| Glycan Youth | Primary | Min 🔴 -> Max 🔵 |
| Glycan Mature | Primary | Max 🔵 -> Min 🔴 |
| Glycan Median | Supportive | Min 🔴 -> Max 🔵 |
| Glycan Bisection | Supportive | Max 🔵 -> Min 🔴 |
Rendering Diseases
For diseases we use our own web component library, ga-components. It's published under the MIT license and available on npm.
We recommend the component library for rendering diseases. That said, these components are opinionated and rigid: they look exactly like the GlycanAge report and nothing else, so they won't fit every use case.
A disease can have anywhere between one and five associated metrics.
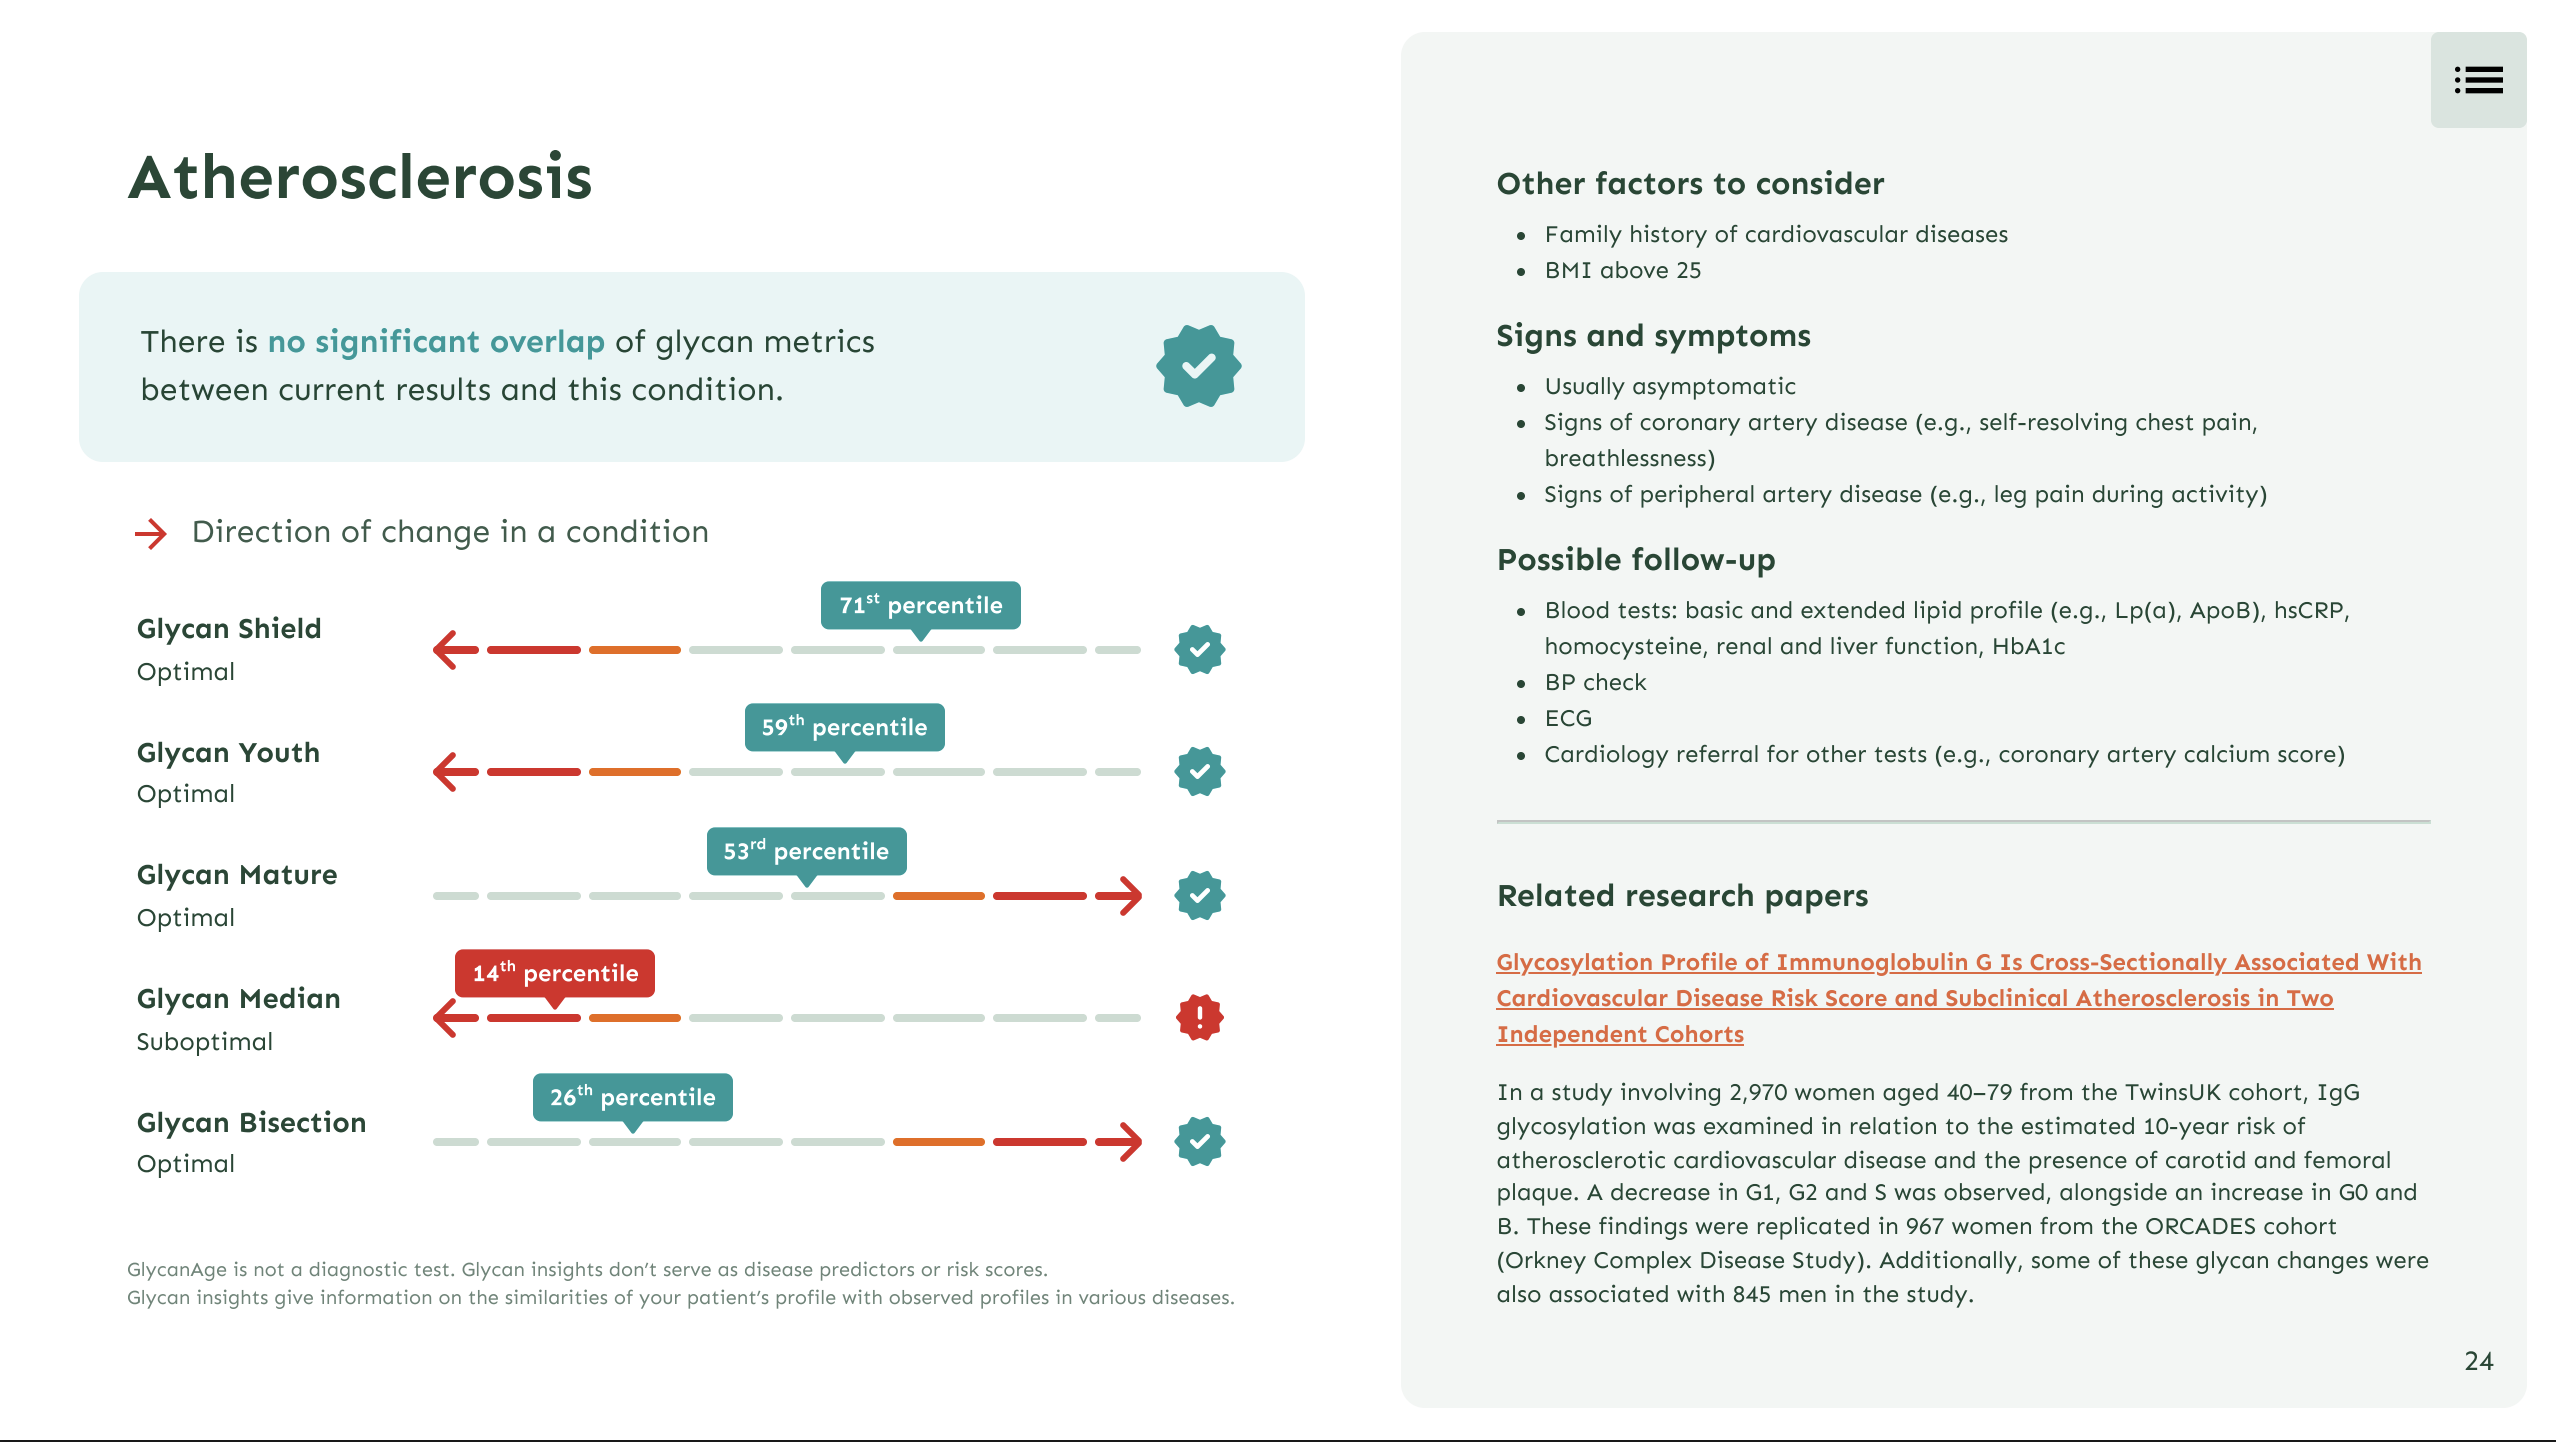
Our report shows 14 diseases. In order of appearance: